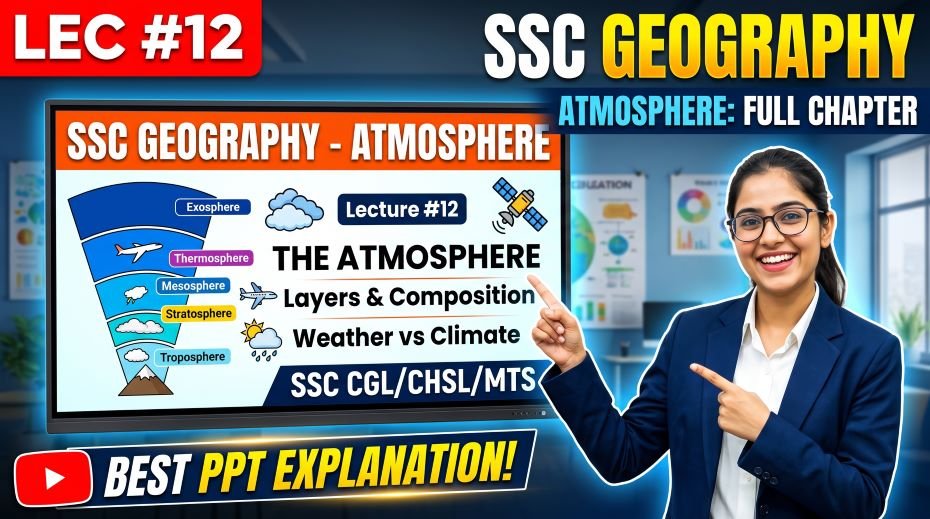
This article accompanies the SSC Geography Atmosphere PPT Slides (LEC #12) – Serial #91 of the Complete Foundation Batch for All SSC Exams PPT Series on slideshareppt.net. With 113 slides in bilingual Hindi + English format, this is one of the most detailed lectures on atmospheric science in the series. This article covers the complete theory on atmospheric layers, composition, pressure, winds, temperature, humidity, and the ozone layer – all aligned to the SSC exam pattern.
The atmosphere is the invisible shield that makes life on Earth possible – regulating temperature, carrying weather, blocking harmful radiation, and driving the global water cycle. For SSC CGL, SSC CHSL, SSC MTS, SSC GD Constable, and RRB Group D exams, Atmosphere Geography is a consistent source of questions covering layers of the atmosphere, composition of air, pressure belts, winds, insolation, and the greenhouse effect.
PPT Resource Overview
| Detail | Information |
| Lecture Number | LEC #12 (Geography Series) |
| Serial Number in Complete Batch | #91 |
| Subject | Geography – Atmosphere (वायुमंडल) |
| Series Name | Complete Foundation Batch for All SSC Exams (PPT Series) |
| Total Slides | 113 PPT Slides |
| File Size | 36 MB |
| Language | Hindi + English (Bilingual) |
| Format Available | Google Slides & Google Drive (PDF also available) |
| Website | www.slideshareppt.net |
| Target Exams | SSC CGL, SSC CHSL, SSC MTS, SSC GD Constable, RRB Group D |
| Suitable For | Students (self-study & marathon revision) and Teachers (classroom use) |
SSC Geography Atmosphere PPT Slides Series (LEC #12)
Note: Above is PPT in GOOGLE SLIDES (HTML AND IFRAME COMBINATION) and if you wish to download the Complete SSC series (PPT slides), visit this Link – REDIRECT PAGE.
Master Timeline: Understanding of the Atmosphere
| Period | Development / Milestone | SSC Relevance |
| ~450 BCE | Empedocles (Greek) identifies air as one of the four classical elements; Aristotle writes Meteorologica – first systematic study of weather | Origin of atmospheric science |
| 1643 | Evangelista Torricelli invents the mercury barometer – first instrument to measure atmospheric pressure | Barometer invention – frequently asked |
| 1714 | Daniel Fahrenheit develops the mercury thermometer and Fahrenheit temperature scale | Temperature measurement history |
| 1742 | Anders Celsius proposes the Celsius temperature scale | Celsius scale origin |
| 1783 | First hot air balloon flight by Montgolfier brothers demonstrates the atmosphere as a navigable medium | Atmospheric exploration |
| 1800s | Scientists systematically measure temperature at altitude – discover that temperature decreases with height in lower atmosphere | Lapse rate concept origin |
| 1862 | James Glaisher and Henry Coxwell ascend ~11 km in a balloon, recording temperatures and pressures at altitude | High-altitude atmospheric measurement |
| 1900 | Léon Teisserenc de Bort discovers the stratosphere – identifies that temperature stops decreasing above ~12 km | Discovery of the stratosphere |
| 1930 | Auguste Piccard reaches the stratosphere in a pressurised balloon gondola | Stratospheric exploration |
| 1930s | Radiosondes (weather balloons with instruments) developed – routine upper-atmosphere monitoring begins | Modern atmospheric monitoring |
| 1970 | Scientists confirm the greenhouse effect as a real and measurable phenomenon | Greenhouse effect confirmation |
| 1985 | British Antarctic Survey scientists discover the ozone hole over Antarctica | Ozone hole discovery |
| 1987 | Montreal Protocol signed – international agreement to phase out ozone-depleting substances (CFCs) | Montreal Protocol – very frequently asked |
| 1988 | IPCC (Intergovernmental Panel on Climate Change) established to assess climate change science | IPCC – current affairs linkage |
| Present Day | Atmosphere monitoring via satellites, radiosondes, and ground stations; focus on greenhouse gas reduction, ozone recovery | Climate change current affairs |
The Atmosphere – Overview and Composition
The atmosphere is the layer of gases surrounding the Earth, held in place by gravity. It extends from the Earth’s surface to approximately 10,000 km above it, though 99% of atmospheric mass is concentrated within the first 32 km. The atmosphere protects life on Earth by absorbing ultraviolet solar radiation through the ozone layer, warming the surface through the greenhouse effect, and reducing the extreme temperature differences between day and night. Without the atmosphere, Earth’s average surface temperature would be approximately −18°C rather than the habitable +15°C it maintains today.
Composition of the Atmosphere – Key Facts
| Gas | Chemical Symbol | % by Volume (Dry Air) | Key SSC Fact |
| Nitrogen | N₂ | 78.09% | Most abundant gas in the atmosphere; relatively inert; dilutes oxygen to prevent fires from burning continuously |
| Oxygen | O₂ | 20.95% | 2nd most abundant; essential for respiration and combustion; decreases with altitude |
| Argon | Ar | 0.93% | 3rd most abundant; noble gas; inert; used in light bulbs |
| Carbon Dioxide | CO₂ | ~0.04% (and rising) | 4th most abundant; essential for photosynthesis; major greenhouse gas; increasing due to burning of fossil fuels |
| Water Vapour | H₂O | Variable (0–4%) | Not counted in ‘dry air’; controls weather; major greenhouse gas; highest near equator and tropics |
| Ozone | O₃ | Trace (mainly in stratosphere) | Found mainly in the ozone layer (stratosphere); absorbs harmful UV radiation; tropospheric ozone is a pollutant |
| Other gases | Various | Trace amounts | Neon, Helium, Methane, Nitrous Oxide, Hydrogen – minor components but some have significant greenhouse effects |
Layers of the Atmosphere – Complete Reference Table
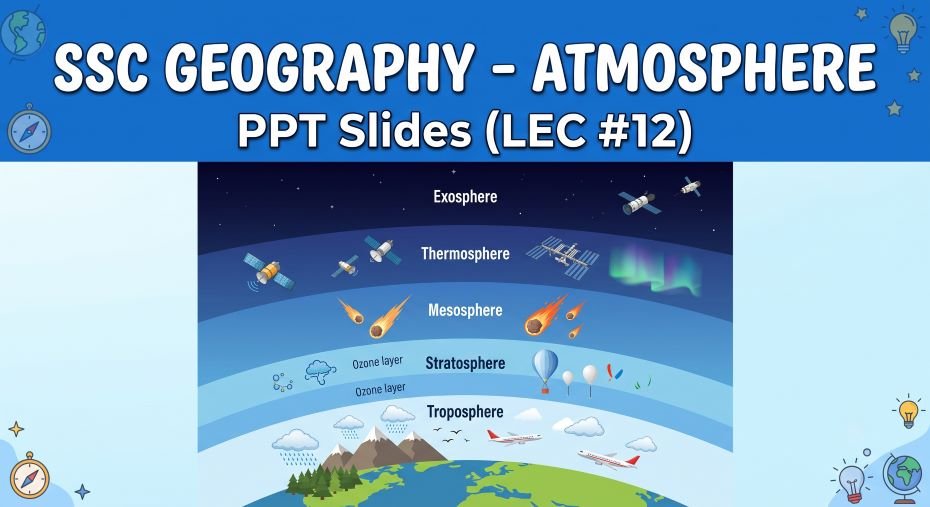
The atmosphere is divided into five main layers based on temperature changes with altitude. Understanding which layer has what temperature behaviour, and what phenomena occur in each layer, is a critical SSC exam topic.
| Layer | Height Range | Temperature Behaviour | Key Features & SSC Importance |
| Troposphere | 0 to ~12 km (varies: ~8 km at poles, ~16 km at equator) | Temperature DECREASES with altitude at ~6.5°C per km (Normal Lapse Rate) | Most important layer for SSC – all weather phenomena (clouds, rain, snow, storms, cyclones) occur here; contains 75–80% of atmospheric mass; the tropopause is its upper boundary |
| Stratosphere | ~12 km to ~50 km | Temperature INCREASES with altitude (due to ozone absorbing UV) | Contains the ozone layer (15–35 km); no weather; jet aircraft fly here; extremely stable; stratopause is upper boundary |
| Mesosphere | ~50 km to ~80 km | Temperature DECREASES with altitude | Coldest layer of atmosphere (−90°C at mesopause); meteors burn up here creating shooting stars; mesopause is upper boundary |
| Thermosphere (Ionosphere) | ~80 km to ~700 km | Temperature INCREASES dramatically with altitude (up to 1500°C+) | Aurora Borealis (Northern Lights) and Aurora Australis occur here; radio waves are reflected from here; ISS (International Space Station) orbits in this layer |
| Exosphere | ~700 km to ~10,000 km | Merges gradually with outer space; no clear upper boundary | Outermost layer; extremely thin; satellites orbit here; hydrogen and helium atoms escape into space from here |
Memory Trick for Atmospheric Layers
In order from Earth’s surface outward: Troposphere → Stratosphere → Mesosphere → Thermosphere → Exosphere
Memory sentence: ‘The Strong Man Takes Exercise’ – T(roposphere), S(tratosphere), M(esosphere), T(hermosphere), E(xosphere)
Atmospheric Pressure Belts – Complete Table
Atmospheric pressure is the weight of air pressing down on Earth’s surface. It decreases with altitude. Pressure varies by latitude, creating distinct pressure belts that drive global wind patterns.
| Pressure Belt | Location (Latitude) | Type | Cause | Effect / Key SSC Fact |
| Equatorial Low Pressure Belt | 0° (Equator) | Low Pressure (Thermal) | Intense solar heating causes air to rise; hot air is lighter | Also called Doldrums (calm winds); heavy rainfall; tropical rainforests; Inter-Tropical Convergence Zone (ITCZ) |
| Sub-Tropical High Pressure Belt | 23.5° N and 23.5° S | High Pressure (Dynamic) | Air that rose at the Equator descends here after cooling at altitude | Descending dry air creates deserts; trade winds originate here; Sahara, Arabian, Thar, Australian deserts located here |
| Sub-Polar Low Pressure Belt | 60° N and 60° S | Low Pressure (Dynamic and Thermal) | Cold polar air meets warmer sub-tropical air; convergence causes air to rise | Frontal activity and depressions (cyclones) form here; temperate cyclones |
| Polar High Pressure Belt | 90° N and 90° S (Poles) | High Pressure (Thermal) | Extreme cold causes air to become dense and sink | Very cold, dry, calm conditions; origin of polar winds |
Global Wind Systems – Complete Reference
Planetary (Permanent) Winds
| Wind | Direction / Belt | From → To | Key SSC Fact |
| Trade Winds | Sub-tropical High (23.5°) toward Equatorial Low (0°) | NE Trade Winds (Northern Hemisphere); SE Trade Winds (Southern Hemisphere) | Most consistent and reliable winds; crucial for early maritime exploration (Columbus used them); blow from subtropical highs toward equator |
| Westerlies | Sub-tropical High (23.5°–30°) toward Sub-polar Low (60°) | Blow from West to East in both hemispheres | Dominant winds of temperate zones; affect European climate; responsible for westward drift of weather systems |
| Polar Easterlies | Polar High (90°) toward Sub-polar Low (60°) | Blow from East (polar regions) toward 60° latitude | Cold, dry winds from the poles; irregular; responsible for cold snaps in high-latitude areas |
Periodic Winds (Seasonal)
| Wind | Type | Region | Key SSC Fact |
| Monsoon Winds | Seasonal reversal of wind direction | South Asia, Southeast Asia, West Africa | SW monsoon (June–Sept) brings rainfall to India; NE monsoon (Oct–Dec) affects Tamil Nadu coast; most important seasonal wind system for India |
| Land Breeze | Nocturnal wind from land to sea | Coastal areas worldwide | Blows at night when land cools faster than sea; sea is warmer, air rises over sea |
| Sea Breeze | Diurnal wind from sea to land | Coastal areas worldwide | Blows during the day when land heats faster than sea; land is warmer, air rises over land |
| Mountain Breeze (Katabatic) | Downslope wind from mountains to valleys at night | Mountainous regions | Cold dense air flows downhill at night from cooler mountain slopes |
| Valley Breeze (Anabatic) | Upslope wind from valleys to mountains during day | Mountainous regions | Warm air rises along slopes as mountain slopes heat up during the day |
Local and Special Winds – Most Asked in SSC
| Wind Name | Type | Region | Key SSC Fact |
| Loo | Hot, dry, dusty wind | Northern India and Pakistan (Gangetic Plain) | Blows in summer (May-June); can cause heatstroke; temperature may exceed 45°C; most frequently asked local wind for India in SSC |
| Chinook | Warm, dry descending wind | Eastern slopes of Rocky Mountains (USA-Canada) | Also called ‘Snow Eater’ – rapidly melts snow on the plains; foehn-type wind |
| Foehn | Warm, dry descending wind | Alps (Switzerland, Austria) | Original foehn-type wind; warm air descends on the leeward side of mountains; causes sudden temperature rise |
| Sirocco | Hot, dry, dusty wind | North Africa (Sahara) blowing toward Mediterranean | Carries Saharan dust into Europe; feels very hot and dry |
| Mistral | Cold, dry wind | Southern France (Rhône Valley toward Mediterranean) | Cold mountain air rushes down; damages crops |
| Bora | Cold, dry, gusty wind | Adriatic coast (Croatia, Slovenia) | Cold descending wind; can be very violent |
| Harmattan | Hot, dry, dusty wind | West Africa (blows from Sahara toward Gulf of Guinea) | Known as ‘Doctor’ because it brings relief from humid tropical heat |
| Khamsin | Hot, dry, dusty wind | Egypt | Blows for 50 days in spring; brings Saharan dust |
| Santa Ana | Hot, dry wind | Southern California (USA) | Descends from inland deserts toward coast; increases wildfire risk |
| Blizzard | Extremely cold storm wind with snow | USA, Canada, polar regions | Visibility near zero; heavy snow and high winds; dangerous conditions |
Atmospheric Temperature – Key Concepts
| Concept | Definition / Detail | SSC Relevance |
| Insolation | Solar radiation received by Earth’s surface; short-wave radiation from the Sun | Basic concept – first step in understanding atmospheric heating |
| Terrestrial Radiation | Long-wave radiation emitted by Earth’s surface back into the atmosphere | Key to understanding the greenhouse effect |
| Normal Lapse Rate | Temperature decreases by ~6.5°C for every 1,000 m gain in altitude in the troposphere | Very frequently asked – air temperature at altitude calculations |
| Environmental Lapse Rate (ELR) | Actual rate of temperature decrease with altitude in the atmosphere at any given time | Real-world variation of lapse rate |
| Temperature Inversion | Unusual condition where temperature INCREASES with altitude (opposite of normal) – warm air layer above cold air | Causes smog and fog to be trapped near the surface; traps pollutants; occurs in valleys on calm nights |
| Isotherm | Line on a map connecting points of equal temperature | Map reading and geography concept |
| Albedo | Reflectivity of a surface – % of solar radiation reflected back without absorption | Snow and ice have high albedo (reflect most sunlight); dark surfaces low albedo (absorb most) |
| Heat Island Effect | Urban areas are warmer than surrounding rural areas due to human activity, concrete, and reduced vegetation | Frequently referenced in SSC Environment questions |
Humidity, Clouds, and Precipitation
| Concept | Definition | Key SSC Fact |
| Humidity | Amount of water vapour present in the air | Measured using a hygrometer |
| Absolute Humidity | Actual amount of water vapour per unit volume of air (g/m³) | Does not change with temperature |
| Relative Humidity | Ratio of actual water vapour to maximum water vapour possible at that temperature (expressed as %) | 100% RH = saturation; dew, fog, and clouds form; measured with a psychrometer (wet and dry bulb thermometer) |
| Dew Point | Temperature at which air becomes saturated and water vapour condenses | Below dew point: dew, frost, fog form |
| Condensation | Process of water vapour cooling and turning into liquid water droplets | Produces dew, fog, clouds, mist |
| Evaporation | Process of liquid water turning into water vapour by absorbing heat | Higher temperature = more evaporation |
| Precipitation | Any form of water falling from the atmosphere to the surface | Includes rain, snow, sleet, hail, drizzle |
| Orographic Rainfall | Rain caused when moist air is forced upward by mountains | Windward side gets heavy rain; leeward side is dry (rain shadow); Western Ghats example in India |
| Convectional Rainfall | Rain caused by intense heating of the ground, causing air to rise rapidly | Common in tropics and Equatorial regions; afternoon thunderstorms |
| Frontal (Cyclonic) Rainfall | Rain caused when warm and cold air masses meet at a front | Common in temperate regions; associated with depressions |
The Greenhouse Effect and Climate Change
| Parameter | Detail |
| Greenhouse Effect (Natural) | Process by which greenhouse gases trap some of Earth’s outgoing heat radiation, keeping Earth’s surface at ~15°C instead of −18°C |
| Greenhouse Gases (GHGs) | Water vapour (most abundant GHG), Carbon Dioxide (CO₂), Methane (CH₄), Nitrous Oxide (N₂O), Ozone (O₃), CFCs |
| Most Potent GHG by volume | Water vapour – most abundant; but not increasing due to human activity |
| GHG with most human impact | Carbon Dioxide (CO₂) – released by burning fossil fuels, deforestation |
| Most potent per molecule | SF₆ (Sulphur hexafluoride) – used in electrical equipment; ~23,500 times more potent than CO₂ |
| Global Warming Potential | CH₄ (Methane) is ~25 times more potent than CO₂ per molecule over 100 years |
| Enhanced Greenhouse Effect | Human activities increasing GHG concentrations, leading to global warming |
| IPCC | Intergovernmental Panel on Climate Change – established 1988; assesses climate science; reports every 5–7 years |
| Paris Agreement | 2015 – nations agreed to limit global warming to well below 2°C above pre-industrial levels |
| Kyoto Protocol | 1997 – first binding international agreement to reduce greenhouse gas emissions |
The Ozone Layer – Complete Facts for SSC
| Parameter | Detail |
| Location | Stratosphere – mainly between 15 km and 35 km altitude |
| Ozone Formula | O₃ (three oxygen atoms) |
| Function | Absorbs 97–99% of the Sun’s harmful ultraviolet (UV) radiation – especially UV-B and UV-C |
| Discovery of Ozone Layer | 1913 – by French physicists Charles Fabry and Henri Buisson |
| Ozone Hole Discovery | 1985 – discovered by British Antarctic Survey scientists over Antarctica |
| Cause of Ozone Depletion | Chlorofluorocarbons (CFCs) – used in refrigerants (Freon), aerosols, foam; break down ozone molecules in the stratosphere |
| Montreal Protocol | Signed 1987; entered force 1989; most successful international environment treaty; phases out CFC production and use |
| Dobson Unit (DU) | Unit for measuring ozone concentration in a column of atmosphere; normal value ~300 DU; ozone hole is region below 220 DU |
| Current Status | Ozone layer is slowly recovering due to the Montreal Protocol; expected to return to pre-1980 levels by ~2065 |
| Effect of Ozone Depletion | Increased UV-B radiation – skin cancer, cataracts, weakened immune systems, harm to marine phytoplankton |
| Largest Ozone Hole | Over Antarctica – forms each spring (September-October in Southern Hemisphere) |
Meteorological Instruments – Quick Reference Table
| Instrument | Measures | Key SSC Fact |
| Barometer | Atmospheric pressure | Invented by Torricelli (1643); mercury barometer and aneroid barometer are two types; falling pressure = rain; rising = fair weather |
| Thermometer | Air temperature | Mercury thermometer (Fahrenheit 1714); Celsius scale (1742); digital thermometers now common |
| Hygrometer | Humidity (water vapour content) of air | Hair hygrometer and psychrometer (wet and dry bulb thermometer) |
| Anemometer | Wind speed | Measures speed of wind; also used to calculate wind force on Beaufort scale |
| Wind Vane | Wind direction | Shows direction from which wind is blowing |
| Rain Gauge | Amount of precipitation (rainfall) | Most basic weather instrument; measured in mm or cm |
| Stevenson Screen | Shelter for standard meteorological instruments | White louvred box placed 1.2 m above ground to protect thermometers from direct radiation |
| Radiosonde | Temperature, humidity, pressure at high altitudes | Weather balloon with instruments; transmitted data wirelessly |
| Pyranometer | Solar radiation (insolation) | Measures incoming solar radiation at Earth’s surface |
Topic-Wise Study Roadmap – Atmosphere for SSC Exams
| Step | Topic | Sub-Topics to Cover | SSC Priority |
| 1 | Composition of Atmosphere | Nitrogen (78%), Oxygen (21%), Argon (0.93%), CO₂ (0.04%), Water Vapour, Ozone | Very High |
| 2 | Layers of Atmosphere | Troposphere, Stratosphere, Mesosphere, Thermosphere, Exosphere – heights, temperatures, key features | Very High |
| 3 | Atmospheric Pressure | Definition, measurement (barometer), units (mb, hPa, mmHg), decrease with altitude | High |
| 4 | Pressure Belts | 4 belts – Equatorial Low, Sub-tropical High, Sub-polar Low, Polar High – causes and effects | Very High |
| 5 | Global Wind Systems | Trade Winds, Westerlies, Polar Easterlies – direction, hemisphere, effects | Very High |
| 6 | Local Winds | Loo (India), Chinook, Foehn, Sirocco, Harmattan, Mistral, Bora, Khamsin – origin and region | High |
| 7 | Temperature Concepts | Insolation, Lapse Rate, Temperature Inversion, Albedo, Isotherms | High |
| 8 | Humidity and Precipitation | Absolute/Relative Humidity, Dew Point, Types of Rainfall (orographic, convectional, frontal) | High |
| 9 | Greenhouse Effect | Natural vs Enhanced, GHGs (CO₂, CH₄, H₂O), Paris Agreement, Kyoto Protocol, IPCC | Very High |
| 10 | Ozone Layer | Location (stratosphere), CFCs, Montreal Protocol, Dobson Unit, ozone hole location (Antarctica) | Very High |
| 11 | Meteorological Instruments | Barometer, Thermometer, Hygrometer, Anemometer, Rain Gauge, Radiosonde | Medium |
Quick Fact Table – Atmosphere for SSC Exams
| Question / Fact | Answer |
| Most abundant gas in atmosphere | Nitrogen – 78.09% |
| 2nd most abundant gas | Oxygen – 20.95% |
| 3rd most abundant gas | Argon – 0.93% |
| Layer where all weather occurs | Troposphere (0–12 km) |
| Layer containing the ozone layer | Stratosphere (15–35 km) |
| Layer where meteors burn up | Mesosphere (50–80 km) |
| Coldest layer of the atmosphere | Mesosphere (up to −90°C at mesopause) |
| Layer where auroras occur | Thermosphere (ionosphere) |
| Layer where satellites orbit | Exosphere |
| Normal Lapse Rate | ~6.5°C per 1,000 m gain in altitude |
| Layer with increasing temperature with altitude (stratosphere) | Stratosphere – due to ozone absorbing UV |
| Temperature Inversion | Unusual condition where temperature INCREASES with altitude – traps fog and smog |
| Most abundant greenhouse gas | Water vapour |
| Most impactful human-produced GHG | Carbon Dioxide (CO₂) |
| Ozone chemical formula | O₃ |
| Substance that destroys ozone | CFCs (Chlorofluorocarbons) |
| International treaty banning CFCs | Montreal Protocol (1987) |
| Unit for measuring ozone concentration | Dobson Unit (DU) |
| Where is the ozone hole largest? | Over Antarctica – each spring (September-October) |
| Doldrums (calm winds) are associated with | Equatorial Low Pressure Belt (0°) |
| Deserts at 23.5° N and S caused by | Sub-Tropical High Pressure Belt – dry descending air |
| Hottest local wind in India | Loo – blows in May-June over northern India |
| ‘Snow Eater’ wind in North America | Chinook – warm descending wind on Eastern Rockies |
| Instrument measuring atmospheric pressure | Barometer (invented by Torricelli, 1643) |
| Instrument measuring humidity | Hygrometer / Psychrometer |
| Instrument measuring wind speed | Anemometer |
| Instrument measuring rainfall | Rain Gauge |
| Process: moist air rises over mountains, produces rain on windward side | Orographic Rainfall |
| Rain shadow side of a mountain is | Leeward side – dry; opposite of windward |
| ITCZ stands for | Inter-Tropical Convergence Zone – equatorial low pressure belt |
also read: SSC Geography Ocean PPT Slides (LEC #11)
Q&A
Q1: Why does the troposphere contain most of Earth’s weather?
The troposphere, extending from Earth’s surface to about 12 km altitude, contains approximately 75–80% of the atmosphere’s total mass, and critically, nearly all of its water vapour. Weather is fundamentally driven by the uneven heating of Earth’s surface, the resulting movement of air masses, and the condensation of water vapour into clouds and precipitation. All of these processes depend on the presence of water vapour and the density of air, both of which are concentrated in the troposphere. Above the tropopause (the upper boundary of the troposphere), the air becomes extremely dry and stable, which is why the stratosphere is cloud-free and weather-free – making the troposphere the exclusive stage for all weather phenomena.
Q2: Why does temperature increase in the stratosphere despite being farther from the Sun?
This is one of the most conceptually important questions in atmospheric geography. In the troposphere, temperature decreases with altitude because the atmosphere is heated primarily from below – the ground absorbs solar energy and radiates it upward as heat. However, in the stratosphere (12–50 km), the ozone layer absorbs incoming ultraviolet radiation directly from the Sun, converting it to heat. This makes the stratosphere warmer at the top than the bottom, reversing the normal lapse rate. This temperature inversion is why the stratosphere is extremely stable with no vertical air mixing – making it ideal for jet aircraft travel and explaining why commercial planes cruise at 10–12 km altitude (just at the tropopause boundary).
Q3: What exactly is the Loo wind and why is it specifically asked in SSC exams?
The Loo is a hot, dry, dusty wind that blows during the summer months of May and June across the Gangetic Plain of northern India and Pakistan. It typically blows from the west and northwest during the afternoon and evening, with temperatures sometimes exceeding 45–48°C, and it is associated with severe heat waves. It is specifically targeted in SSC exams because it is India’s most prominent and dangerous local wind phenomenon, and questions about local winds in Asia frequently cite the Loo alongside other Asian examples. Extended exposure to the Loo can be fatal, and it significantly affects agriculture and daily life in Uttar Pradesh, Haryana, Punjab, and Rajasthan during summer.
Q4: What is temperature inversion and how does it cause urban air pollution?
Temperature inversion is an atmospheric condition where the normal decrease of temperature with altitude is reversed – a layer of warm air sits above a layer of cooler air near the surface. This stable configuration prevents vertical air mixing, trapping pollutants, dust, and smog close to the ground instead of allowing them to rise and disperse. Temperature inversions are most common on calm, clear winter nights when the surface radiates heat away rapidly and cools below the air above it, and are particularly common in valleys where cold air drains downhill and pools. Cities like Delhi experience severe smog episodes in winter partly due to temperature inversions trapping vehicle and industrial emissions near the surface.
Q5: What is the difference between the Kyoto Protocol and the Paris Agreement?
The Kyoto Protocol, adopted in 1997 and entered into force in 2005, was the first legally binding international agreement requiring developed countries to reduce greenhouse gas emissions by specific targets relative to 1990 levels – developing countries including India and China had no binding reduction commitments. The Paris Agreement, adopted at COP21 in Paris in 2015 and entered into force in 2016, took a broader approach in which all countries – developed and developing – submitted their own voluntary national targets (Nationally Determined Contributions or NDCs) for emission reduction, with the collective goal of limiting global average temperature rise to well below 2°C above pre-industrial levels. Both are frequently tested together in SSC Current Affairs and Environment-Geography sections.
Q6: Why does the Montreal Protocol succeed where climate treaties often struggle?
The Montreal Protocol, adopted in 1987 to phase out ozone-depleting substances (primarily CFCs), is widely regarded as the most successful international environmental treaty in history because it achieved near-universal adoption (189 countries), set clear and enforceable phase-out schedules, had strong industry cooperation from chemical manufacturers who developed CFC alternatives, and produced measurable results – the ozone layer is now slowly recovering and is expected to return to pre-1980 levels by approximately 2065. The protocol succeeded partly because it targeted a specific set of chemicals with viable replacements, unlike greenhouse gas reduction which requires restructuring entire energy systems.
Q7: How does orographic rainfall explain India’s uneven rainfall distribution?
Orographic or relief rainfall occurs when moisture-laden winds are forced to rise over mountains or elevated terrain. As the air rises, it cools, and the water vapour condenses to form clouds and rainfall on the windward (facing the wind) side. Once the air crosses the mountain and descends on the leeward side, it warms, its relative humidity drops, and little rain falls – creating a rain shadow zone. This mechanism perfectly explains why the Western Ghats receive over 3,000 mm of annual rainfall on their windward (western, Arabian Sea) side, while the Deccan Plateau on the leeward eastern side receives comparatively little. Similarly, Cherrapunji and Mawsynram in Meghalaya receive among the world’s highest rainfall because they sit at the base of the Khasi Hills facing the Bay of Bengal branch of the monsoon.
Rapid Revision Cheat Sheet – Atmosphere Geography
| Topic | Key Point |
| Most abundant gas | Nitrogen – 78.09% |
| 2nd most abundant | Oxygen – 20.95% |
| Troposphere height | 0–12 km (weather layer; all weather here) |
| Stratosphere height | 12–50 km (ozone layer here; temp rises with altitude) |
| Mesosphere height | 50–80 km (coldest layer; meteors burn here) |
| Thermosphere height | 80–700 km (auroras; ISS; temp rises dramatically) |
| Exosphere height | 700–10,000 km (satellites; merges into space) |
| Normal Lapse Rate | ~6.5°C decrease per 1,000 m altitude |
| Temperature Inversion | Warm air above cold air – traps pollution and fog |
| Equatorial Low Pressure belt | 0° – Doldrums – heavy rain, calm winds, ITCZ |
| Sub-Tropical High | 23.5° N & S – deserts; origin of trade winds |
| Sub-Polar Low | 60° N & S – temperate cyclones, frontal rainfall |
| Polar High | 90° N & S – cold, dry, calm |
| Trade Winds | Blow from Sub-tropical High → Equator |
| Westerlies | Blow from Sub-tropical High → Sub-polar Low (west to east) |
| Polar Easterlies | Blow from Polar High → Sub-polar Low |
| Loo (India) | Hot dry wind, northern India, May-June, up to 48°C |
| Chinook (N. America) | Warm descending wind, eastern Rockies, ‘Snow Eater’ |
| Foehn (Europe) | Warm descending wind, leeward of Alps |
| Harmattan (W. Africa) | Hot dry Saharan wind; called ‘The Doctor’ |
| Most abundant GHG | Water vapour |
| Most impactful human GHG | Carbon Dioxide (CO₂) |
| Ozone layer location | Stratosphere – 15–35 km |
| Ozone-depleting substance | CFCs (Chlorofluorocarbons) |
| Montreal Protocol | 1987 – phases out CFCs – most successful env. treaty |
| Dobson Unit | Measure of ozone concentration in atmosphere |
| Ozone hole location | Antarctica – forms each spring (Sept-Oct) |
| Kyoto Protocol | 1997 – binding GHG reduction for developed nations |
| Paris Agreement | 2015 – all nations; limit warming to <2°C |
| Orographic Rainfall | Windward side of mountains gets rain; leeward side dry |
| Serial number of this PPT | #91 in the Complete Foundation Batch |
Conclusion
Atmosphere Geography is a topic that rewards deep conceptual understanding more than any other chapter in SSC Geography – because the examiner tests relationships, not just definitions. Knowing that the stratosphere is warm due to ozone, that deserts at 23.5° exist because of the sub-tropical high, that the Loo is India’s deadliest local wind, and that the Montreal Protocol succeeded precisely because it tackled a specific chemical problem – these connected understandings are what separate high scorers from average ones.
The SSC Geography Atmosphere PPT Slides (LEC #12), Serial #91, available at slideshareppt.net in bilingual Hindi + English format across 113 slides, gives you the complete visual learning system for this topic. Revisit the atmospheric layers table, pressure belt chain, and the local winds reference table. Use the Rapid Revision Cheat Sheet in your final week before the exam, and this topic will consistently deliver marks across every SSC and RRB paper.