This article accompanies the SSC Geography Earthquake PPT Slides Series (LEC #13) – Serial #92 of the Complete Foundation Batch for All SSC Exams PPT Series on slideshareppt.net. With 106 slides in bilingual Hindi + English format, this lecture covers earthquake geography in complete depth. This article presents the full theory, timeline, comparison tables, and a rapid revision cheat sheet aligned to the SSC exam pattern.
Earthquakes are among the most powerful and destructive natural forces on Earth, and they feature prominently in SSC CGL, SSC CHSL, SSC MTS, SSC GD Constable, and RRB Group D General Awareness sections – both in physical geography and in Current Affairs, where major earthquakes regularly generate news. From the mechanics of tectonic plates and seismic waves to the Richter and Moment Magnitude scales, earthquake zones, and India’s seismic zones, this topic demands thorough preparation.
PPT Resource Overview
| Detail | Information |
| Lecture Number | LEC #13 (Geography Series) |
| Serial Number in Complete Batch | #92 |
| Subject | Geography – Earthquake (भूकंप) |
| Series Name | Complete Foundation Batch for All SSC Exams (PPT Series) |
| Total Slides | 106 PPT Slides |
| File Size | 6 MB |
| Language | Hindi + English (Bilingual) |
| Format Available | Google Slides & Google Drive (PDF also available) |
| Website | www.slideshareppt.net |
| Target Exams | SSC CGL, SSC CHSL, SSC MTS, SSC GD Constable, RRB Group D |
| Suitable For | Students (self-study & marathon revision) and Teachers (classroom use) |
SSC Geography Earthquake PPT Slides Series (LEC #13)
Note: Above is PPT in GOOGLE SLIDES (HTML AND IFRAME COMBINATION) and if you wish to download the Complete SSC series (PPT slides), visit this Link – REDIRECT PAGE.
Master Timeline: Earthquake Science and Major Events
| Period / Year | Event / Milestone | SSC Relevance |
| ~132 CE | Zhang Heng (China) invents the first seismoscope – a device that detected the direction of distant earthquakes | First seismological instrument |
| 1755 | Lisbon Earthquake (Portugal) – one of the deadliest in European history; ~60,000 deaths; triggered tsunami and fire | 18th-century earthquake disaster |
| 1811–1812 | New Madrid earthquakes (Missouri, USA) – among the strongest in North American history; caused the Mississippi River to flow backward temporarily | Major intraplate earthquake |
| 1880 | John Milne (British) develops the modern seismograph in Japan | Seismograph invention |
| 1906 | San Francisco Earthquake – ~7.9 Mw; destroyed much of the city; caused massive fire; ~3,000 deaths | Famous US earthquake |
| 1915 | Alfred Wegener proposes the theory of Continental Drift – tectonic plates moving over time | Plate tectonics origin – very frequently asked |
| 1935 | Charles Richter develops the Richter Magnitude Scale for measuring earthquake intensity | Richter Scale origin – very frequently asked |
| 1960 | Valdivia Earthquake, Chile – strongest earthquake ever recorded at 9.5 Mw; triggered Pacific-wide tsunami | Most powerful earthquake ever |
| 1964 | Good Friday Earthquake, Alaska (9.2 Mw) – 2nd most powerful earthquake ever recorded | 2nd most powerful earthquake |
| 1970s | Plate Tectonics Theory fully established as the accepted framework for explaining earthquakes and volcanoes | Modern earthquake science foundation |
| 2004 (26 Dec) | Indian Ocean Earthquake and Tsunami – 9.1–9.3 Mw; triggered massive tsunami killing ~230,000 people across 14 countries; worst tsunami in recorded history | Most asked earthquake disaster – India-linked (Andaman & Nicobar affected) |
| 2005 (8 Oct) | Kashmir Earthquake – 7.6 Mw; ~75,000 deaths in Pakistan-administered Kashmir and India | Major South Asian earthquake affecting India |
| 2008 (12 May) | Sichuan Earthquake, China – 7.9 Mw; ~87,000 deaths | Major Chinese earthquake |
| 2010 (12 Jan) | Haiti Earthquake – 7.0 Mw; ~316,000 deaths; one of deadliest earthquakes in history due to poor construction | Deadliest earthquake in recent history |
| 2011 (11 Mar) | Tōhoku Earthquake, Japan – 9.1 Mw; triggered massive tsunami; Fukushima nuclear disaster | Japan’s most powerful recorded earthquake; triggered nuclear crisis |
| 2015 (25 Apr) | Nepal Earthquake – 7.8 Mw (Gorkha earthquake); ~9,000 deaths; severe damage to Kathmandu and heritage sites | Very frequently asked – South Asia; India-linked |
| 2023 (6 Feb) | Turkey-Syria Earthquake – 7.8 Mw; ~60,000+ deaths; one of the deadliest earthquakes of the 21st century | Very recent major earthquake – current affairs |
Earthquakes – Overview and Basic Concepts
An earthquake is the sudden shaking of the Earth’s surface caused by the release of energy stored in rocks, typically as a result of movement along faults or at tectonic plate boundaries. The energy is released in the form of seismic waves that radiate outward from the point of origin. The science of studying earthquakes is called seismology, and the instrument used to detect and record seismic waves is called a seismograph (or seismometer). Approximately 500,000 detectable earthquakes occur on Earth every year, of which about 100,000 can be felt by people and fewer than 100 cause significant damage.
Earthquake Terminology – Key Terms for SSC
| Term | Definition | SSC Key Fact |
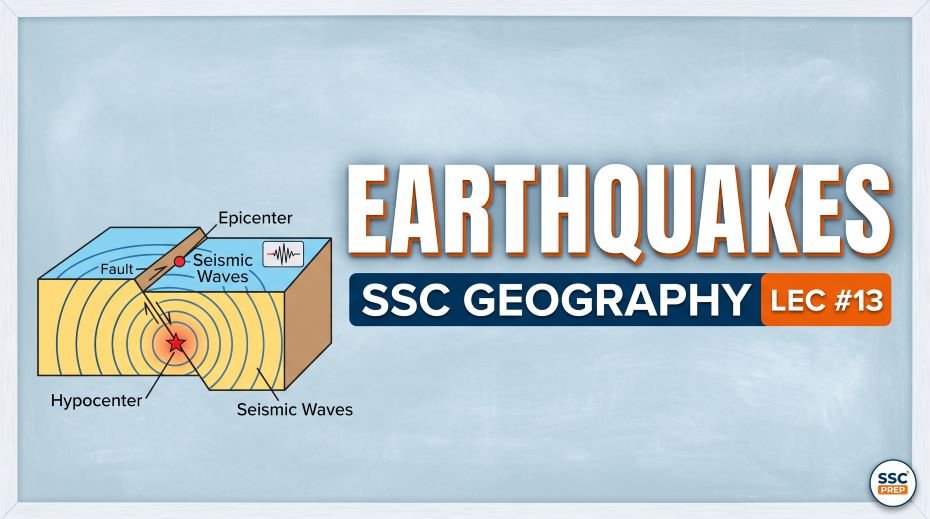
| Focus (Hypocenter) | The point inside the Earth where the earthquake originates; where energy is first released | Focus is underground; depth determines earthquake type |
| Epicentre | The point on the Earth’s surface directly above the focus; experiences maximum shaking | Epicentre is on the surface; damage is greatest here |
| Seismic Waves | Energy waves that travel outward from the focus through the Earth | Three main types: P-waves, S-waves, Surface waves |
| Seismograph | Instrument that detects and records seismic waves | Seismogram = the recorded tracing; seismograph = the instrument |
| Seismology | The scientific study of earthquakes and seismic waves | Seismologist = scientist who studies earthquakes |
| Fault | A fracture or zone of fractures in the Earth’s crust along which rocks have moved | Faults are the most common cause of earthquakes |
| Aftershock | Smaller earthquakes that follow a main earthquake along the same fault zone | Can continue for days, weeks, or months after main quake |
| Foreshock | Smaller earthquakes that precede a larger earthquake in the same area | Not always present; difficult to identify in advance |
| Magnitude | A measure of the energy released by an earthquake (logarithmic scale) | Richter Scale and Moment Magnitude Scale |
| Intensity | A measure of the shaking felt at a specific location; varies with distance from epicentre | Modified Mercalli Intensity Scale (I to XII) |
| Liquefaction | Process by which saturated, loose soil temporarily loses strength and behaves like a liquid during shaking | Causes buildings to sink or topple; major secondary hazard |
| Tsunami | Ocean waves generated by an undersea earthquake, volcanic eruption, or submarine landslide | From Japanese – ‘harbour wave’; very fast (800 km/h in open ocean) |
Types of Earthquakes – Classification
| Classification By | Type | Description | Example / Key Fact |
| Cause | Tectonic Earthquake | Caused by movement of tectonic plates along faults; most common type | ~90% of all earthquakes; e.g. Nepal 2015, Japan 2011 |
| Cause | Volcanic Earthquake | Caused by movement of magma inside volcanoes | Associated with volcanic regions; Kilauea (Hawaii) |
| Cause | Collapse Earthquake | Caused by collapse of underground caves or mines | Local; limited area affected; rare |
| Cause | Induced / Reservoir-triggered | Caused by human activities like dam construction, mining, or injection of fluids into Earth | Koyna earthquake (1967, Maharashtra) – India’s worst reservoir-triggered earthquake |
| Depth of Focus | Shallow focus | Focus depth: 0–70 km | Most destructive; energy reaches surface quickly; >70% of quakes |
| Depth of Focus | Intermediate focus | Focus depth: 70–300 km | Less destructive than shallow |
| Depth of Focus | Deep focus | Focus depth: 300–700 km | Least common; energy largely absorbed before reaching surface |
Types of Seismic Waves – Complete Reference Table
| Wave Type | Full Name | Travel Path | Speed | Medium | Key SSC Fact |
| P-Wave | Primary Wave (Compressional / Longitudinal) | Travel through solid, liquid, and gas; can pass through Earth’s core | Fastest – first to arrive at seismograph | Solid + Liquid + Gas | Also called Push-Pull waves; first detected; travel through all states of matter – most important wave for SSC |
| S-Wave | Secondary Wave (Shear / Transverse) | Travel only through solid material; cannot pass through liquid or gas | Slower than P-waves; arrive 2nd | Solid only | Also called Shake waves; cannot pass through outer core (liquid) – this proves Earth’s outer core is liquid; crucial fact |
| L-Wave (Love Wave) | Surface Wave (Love Wave) | Travel along Earth’s surface horizontally | Slowest | Surface only | Most destructive; responsible for most building damage; travel along surface not through Earth |
| R-Wave (Rayleigh Wave) | Surface Wave (Rayleigh Wave) | Travel along Earth’s surface in a rolling motion | Slowest | Surface only | Move like ocean waves; cause vertical and horizontal ground movement |
Earthquake Measurement Scales
Richter Magnitude Scale
The Richter Scale, developed by Charles Richter in 1935, measures the magnitude (energy released) of an earthquake on a logarithmic scale – meaning each whole number increase represents approximately 31.6 times more energy released, not simply 10 times more. It is most accurate for local earthquakes of moderate size.
| Richter Magnitude | Description | Effect |
| Less than 2.0 | Micro | Not felt; detected only by instruments |
| 2.0 – 2.9 | Minor | Generally not felt; recorded by instruments |
| 3.0 – 3.9 | Minor | Often felt; rarely causes damage |
| 4.0 – 4.9 | Light | Noticeable shaking; minor damage possible |
| 5.0 – 5.9 | Moderate | Significant damage to poorly constructed buildings |
| 6.0 – 6.9 | Strong | Destructive in populated areas; serious damage |
| 7.0 – 7.9 | Major | Serious damage over large areas; major disaster |
| 8.0 – 8.9 | Great | Devastating; can destroy cities |
| 9.0 and above | Extreme / Great | Rarely occurring; catastrophic; e.g. 2004 Indian Ocean (9.1), Chile 1960 (9.5) |
Modified Mercalli Intensity Scale
While the Richter Scale measures energy at the source, the Modified Mercalli Intensity (MMI) Scale measures the intensity of shaking experienced at a specific location, expressed as Roman numerals from I (not felt) to XII (complete destruction). It is subjective – based on observed effects on people, buildings, and objects – and varies with distance from the epicentre.
Plate Tectonics and Earthquake Zones
The theory of plate tectonics, which became the accepted scientific framework by the 1970s, holds that Earth’s outer shell (the lithosphere) is divided into about 15 major tectonic plates that float on the semi-molten asthenosphere below. Earthquakes occur predominantly at the boundaries of these plates.
| Plate Boundary Type | Movement | Earthquake Type | Example |
| Convergent Boundary | Two plates move toward each other; one may subduct beneath the other | Strong, often deep earthquakes; subduction zones are most powerful earthquake zones | Pacific Ring of Fire; Japan, Chile, Cascadia subduction zone |
| Divergent Boundary | Two plates move apart; magma fills the gap creating new crust | Generally shallow, moderate earthquakes | Mid-Atlantic Ridge; East African Rift Valley |
| Transform Fault Boundary | Two plates slide horizontally past each other | Shallow, often very destructive earthquakes | San Andreas Fault (California); North Anatolian Fault (Turkey) |
| Intraplate Earthquake | Occurs within a tectonic plate, far from plate boundaries | Can be destructive despite being within a stable plate | Koyna, Maharashtra (1967); Bhuj, Gujarat (2001) |
The Pacific Ring of Fire
| Parameter | Detail |
| Location | Horseshoe-shaped zone encircling the Pacific Ocean |
| Length | ~40,000 km |
| Earthquakes | Accounts for approximately 90% of the world’s earthquakes |
| Volcanoes | Contains approximately 75% of the world’s active volcanoes |
| Countries on the Ring | Japan, Philippines, Indonesia, Papua New Guinea, New Zealand, Chile, Peru, Colombia, Mexico, USA (Alaska, California), Russia (Kamchatka) |
| Why Earthquakes here? | Multiple tectonic plates converge and subduct along the Ring – creating the highest seismic and volcanic activity on Earth |
| Major events on the Ring | 2004 Indian Ocean Tsunami (Sumatra), 2011 Japan Tōhoku earthquake, 1960 Chile earthquake, 1964 Alaska earthquake |
| SSC Importance | Very high – ‘Ring of Fire’ as a term and its earthquake/volcano statistics are frequently asked |
India’s Seismic Zone Map – Complete Reference
The Bureau of Indian Standards (BIS) divides India into four seismic zones based on earthquake risk, from Zone II (lowest risk) to Zone V (highest risk). This classification is used for earthquake-resistant building design across India.
| Zone | Risk Level | Intensity (MMI) | Key States / Regions |
| Zone II | Lowest seismic hazard | VI or less | Parts of South India – stable Deccan Plateau region; parts of Rajasthan, MP, Chhattisgarh |
| Zone III | Moderate seismic hazard | VII | Parts of Kerala, Karnataka, Andhra Pradesh, Maharashtra, Odisha, Jharkhand, Bihar, West Bengal |
| Zone IV | High seismic hazard | VIII | Entire National Capital Region (Delhi-NCR), parts of Jammu & Kashmir, Himachal Pradesh, Haryana, Punjab, UP Terai region, Maharashtra (including Mumbai) |
| Zone V | Very High (Highest) seismic hazard | IX and above | Entire Northeast India (Arunachal Pradesh, Assam, Manipur, Meghalaya, Mizoram, Nagaland, Sikkim, Tripura); entire J&K and Himachal Pradesh; Gujarat (Kutch region); Andaman & Nicobar Islands; parts of Bihar-Nepal border |
Key Earthquake Events in India
| Earthquake | Year | Magnitude | Zone | Deaths (approx.) | Key SSC Fact |
| Kangra Earthquake (HP) | 1905 | 7.8 Mw | Zone IV | ~19,000 | Worst earthquake in Himachal Pradesh history |
| Bihar-Nepal Earthquake | 1934 | 8.0 Mw | Zone IV/V | ~30,000 | Major Himalayan earthquake; devastated Bihar |
| Assam Earthquake | 1950 | 8.6 Mw | Zone V | ~1,500+ | One of the strongest earthquakes ever recorded in India |
| Koyna Earthquake (Maharashtra) | 1967 | 6.5 Mw | Zone III | ~200 | Famous reservoir-triggered earthquake; caused by Koyna Dam |
| Uttarkashi Earthquake (UK) | 1991 | 6.8 Mw | Zone V | ~768 | Major Himalayan earthquake; Garhwal region |
| Latur-Osmanabad Earthquake (MH) | 1993 | 6.2 Mw | Zone III | ~9,748 | Shocking – occurred in low-risk zone; poor construction; one of deadliest in India |
| Jabalpur Earthquake (MP) | 1997 | 6.0 Mw | Zone III | ~38 | Central India; unexpected intraplate event |
| Bhuj Earthquake (Gujarat) | 2001 | 7.7 Mw | Zone V | ~20,000+ | Most devastating earthquake in India in recent history; struck on Republic Day (26 Jan); Kutch region |
| Kashmir Earthquake | 2005 | 7.6 Mw | Zone V | ~75,000 (mainly Pakistan) | Cross-border disaster; significant India impact in J&K |
| Sikkim Earthquake | 2011 | 6.9 Mw | Zone IV/V | ~111 | Northeast India; high altitude Himalayan zone |
| Nepal-India Earthquake (Gorkha) | 2015 | 7.8 Mw | Zone V border | ~9,000 (Nepal) | Severely affected Nepal; Bihar and UP in India also felt strong shaking |
Tsunamis – Earthquake-Generated Ocean Waves
| Parameter | Detail |
| Origin of Word | Japanese – ‘tsu’ (harbour) + ‘nami’ (wave) |
| Cause | Undersea earthquake (most common), volcanic eruption, submarine landslide, or meteor impact |
| Speed in Open Ocean | ~800–900 km/h (as fast as a jet aircraft) |
| Wave Height in Open Ocean | Less than 1 metre – nearly undetectable |
| Wave Height at Shore | Can reach 30 m or more as the wave ‘piles up’ in shallow water |
| Warning Systems | Pacific Tsunami Warning System (PTWS); Indian Ocean Tsunami Warning System (established post-2004) |
| Deadliest Tsunami | 2004 Indian Ocean Tsunami – ~230,000 deaths across 14 countries |
| Cause of 2004 Tsunami | 9.1–9.3 Mw undersea earthquake off the coast of Sumatra, Indonesia |
| Indian Regions Affected (2004) | Andaman & Nicobar Islands (worst hit), Tamil Nadu coast, Puducherry, Andhra Pradesh, Kerala |
| SSC Importance | Very high – 2004 Indian Ocean Tsunami details (magnitude, death toll, regions) are among the most frequently asked disaster geography facts |
Earth’s Interior – Structure and Seismic Evidence
| Layer | Depth Range | Composition | Evidence from Seismic Waves |
| Crust | 0–35 km (continental); 0–10 km (oceanic) | Solid rock; Si, Al (continental – SIAL); Si, Mg (oceanic – SIMA) | Both P and S waves pass through; thin outer shell |
| Mantle | 35–2,900 km | Dense solid rock (mainly olivine and pyroxene); partially molten asthenosphere (~100–250 km) | Both P and S waves pass; velocity increases; convection currents here drive plate movement |
| Outer Core | 2,900–5,100 km | Liquid – mainly iron and nickel | S-waves CANNOT pass through outer core – proves it is liquid; P-waves slow down and bend here |
| Inner Core | 5,100–6,371 km | Solid – mainly iron and nickel; very high pressure forces solid state | P-waves can pass; S-waves re-emerge (mode-converted); rotation slightly faster than surface |
also read: SSC Geography Atmosphere PPT Slides Series (LEC #12)
Quick Fact Table – Earthquake Geography for SSC
| Question / Fact | Answer |
| Who developed the Richter Scale and when? | Charles Richter – 1935 |
| Strongest earthquake ever recorded | Valdivia Earthquake, Chile – 9.5 Mw (1960) |
| 2nd strongest earthquake ever recorded | Good Friday Earthquake, Alaska – 9.2 Mw (1964) |
| Deadliest tsunami in history | 2004 Indian Ocean Tsunami – ~230,000 deaths across 14 countries |
| Cause of 2004 Indian Ocean Tsunami | 9.1 Mw undersea earthquake off Sumatra, Indonesia (26 December 2004) |
| Most devastating earthquake in India (recent history) | Bhuj Earthquake, Gujarat – 7.7 Mw, 26 January 2001 |
| India’s worst reservoir-triggered earthquake | Koyna Earthquake, Maharashtra – 1967 |
| Seismic zone with highest earthquake risk in India | Zone V – Northeast India, J&K, Kutch (Gujarat), Andaman & Nicobar |
| Delhi-NCR falls in which seismic zone? | Zone IV – High seismic hazard |
| First to reach seismograph after an earthquake | P-Waves (Primary Waves) – fastest |
| Wave that proves Earth’s outer core is liquid | S-Waves (cannot pass through liquid outer core) |
| Most destructive seismic wave at the surface | Surface Waves (L-waves and R-waves) |
| Percentage of earthquakes in the Ring of Fire | ~90% |
| Percentage of world’s active volcanoes in Ring of Fire | ~75% |
| Strongest earthquake ever recorded in India | Assam Earthquake – 8.6 Mw (1950) |
| Nepal Earthquake (Gorkha) year and magnitude | 2015 – 7.8 Mw |
| Turkey-Syria Earthquake year and magnitude | 2023 – 7.8 Mw – ~60,000+ deaths |
| Japan’s most powerful earthquake (Tōhoku) | 2011 – 9.1 Mw – triggered Fukushima nuclear disaster |
| Point inside Earth where earthquake originates | Focus (Hypocenter) |
| Point on surface directly above Focus | Epicentre |
| Who proposed Continental Drift theory? | Alfred Wegener – 1915 |
| First seismoscope inventor (132 CE) | Zhang Heng – China |
| Speed of tsunami waves in the open ocean | ~800–900 km/h |
| Latur-Osmanabad earthquake is significant because | Major earthquake in low-risk Zone III – showed risk of poor construction |
| BIS full form (seismic zones) | Bureau of Indian Standards |
Q&A:
Q1: What is the difference between the Focus and the Epicentre of an earthquake?
The focus, also called the hypocenter, is the actual point inside the Earth where the earthquake originates – where the fault ruptures and energy is first released. It can be anywhere from a few kilometres to nearly 700 km below the surface. The epicentre is the point on the Earth’s surface directly above the focus, connected to it by a vertical line. The epicentre is not where the earthquake starts, but it is where the greatest surface shaking is typically experienced, because the seismic waves have the shortest travel distance to reach it from the focus. The distinction between focus and epicentre is a very commonly tested question in SSC Geography.
Q2: How do seismic waves reveal the structure of Earth’s interior?
Seismologists analyse the behaviour of P-waves and S-waves as they travel through the Earth to deduce its internal structure. P-waves can travel through all states of matter – solid, liquid, and gas – while S-waves can only travel through solids. When a major earthquake occurs, seismographs around the world record both wave types. Scientists found a ‘shadow zone’ on the far side of the Earth where S-waves do not arrive, which proves that the outer core is liquid (since S-waves cannot pass through it). P-waves do reach the far side but travel at reduced speed and bent paths, confirming the outer core is denser than the mantle. The inner core, however, appears solid because P-waves travel faster through it again.
Q3: Why was the Bhuj earthquake of 2001 so devastating for India?
The Bhuj earthquake struck on 26 January 2001 – Republic Day – at 8:46 AM local time with a magnitude of 7.7 Mw, centred in the Kutch region of Gujarat. It is the most devastating earthquake in India’s modern history, killing approximately 20,000 people, injuring over 166,000, and destroying over 400,000 homes. The catastrophic death toll resulted from a combination of factors: the Kutch region is classified as Seismic Zone V (the highest risk zone), the earthquake occurred in the early morning when most people were still indoors, the area had widespread poorly constructed buildings with inadequate reinforcement, and the shaking liquefied loose soil in many areas, causing structures to collapse. The Bhuj earthquake transformed India’s approach to earthquake-resistant construction and disaster preparedness.
Q4: What makes the Pacific Ring of Fire so seismically active?
The Pacific Ring of Fire is a roughly horseshoe-shaped zone encircling the Pacific Ocean where approximately 90% of the world’s earthquakes and 75% of its active volcanoes are concentrated. This extraordinary concentration of seismic activity exists because the Ring of Fire marks the edges of the Pacific Plate and several adjacent smaller plates, where these plates converge with neighbouring plates in subduction zones – one plate being forced beneath another as they collide. Subduction zones generate the most powerful earthquakes on Earth because they accumulate enormous amounts of stress over decades and centuries before rupturing catastrophically. The 2004 Indian Ocean Tsunami (Sumatra), the 2011 Japan earthquake, and the 1960 Chile earthquake were all generated by subduction zone ruptures on or near the Ring of Fire.
Q5: What happened in the 2004 Indian Ocean Tsunami and how did it affect India?
On 26 December 2004, a massive 9.1–9.3 Mw undersea earthquake ruptured off the northern coast of Sumatra, Indonesia, displacing a vast section of the sea floor and triggering the deadliest tsunami in recorded history. The resulting ocean waves radiated outward across the Indian Ocean at speeds of approximately 800 km/h, reaching the coasts of Thailand, Sri Lanka, India, the Maldives, and eventually East Africa within hours. The disaster killed approximately 230,000 people across 14 countries. India’s Andaman & Nicobar Islands were the worst affected Indian territory – Indira Point, India’s southernmost tip on Great Nicobar Island, was partially submerged. The Tamil Nadu coast, Puducherry, Andhra Pradesh coast, and Kerala also suffered significant casualties and damage. This event prompted India and the broader Indian Ocean community to establish the Indian Ocean Tsunami Warning System.
Q6: How does India’s seismic zone classification work and which regions are most at risk?
India’s Bureau of Indian Standards (BIS) divides the country into four seismic zones – II, III, IV, and V – based on historical earthquake data, geological structures, and estimated future seismic hazard. Zone V carries the highest earthquake risk and covers the entire Northeast India (Assam, Manipur, Meghalaya, Arunachal Pradesh, Nagaland, Mizoram, Tripura, Sikkim), the entire Jammu & Kashmir and Himachal Pradesh, the Kutch region of Gujarat, the Andaman & Nicobar Islands, and parts of the Bihar-Nepal border region. Zone IV covers Delhi-NCR, parts of Jammu & Kashmir, Haryana, Punjab, and the UP Terai – a particularly important classification since Delhi with its massive population and dense construction sits in a high seismic risk area.
Q7: What is the difference between earthquake magnitude and earthquake intensity?
Magnitude and intensity are two different but complementary ways of describing an earthquake. Magnitude, measured on the Richter Scale or the Moment Magnitude Scale (Mw), quantifies the total energy released at the earthquake’s source – it is a single fixed number for any given earthquake, independent of where you are standing. Intensity, measured on the Modified Mercalli Intensity (MMI) Scale using Roman numerals from I to XII, describes the actual shaking experienced at a specific location on the surface – it varies depending on how far you are from the epicentre, the local geological conditions, and building quality. A single earthquake with one magnitude number will produce many different intensity readings across different locations – strongest at the epicentre and weakening with distance.
Rapid Revision Cheat Sheet – Earthquake Geography
| Topic | Key Point |
| Focus / Hypocenter | Point inside Earth where earthquake originates |
| Epicentre | Point on surface directly above the focus |
| Seismology | Study of earthquakes; seismograph = recording instrument |
| P-Waves | Primary / Fastest; travel through solid, liquid, gas |
| S-Waves | Secondary; travel only through solid; prove outer core is liquid |
| Surface Waves | Slowest; most destructive; travel along Earth’s surface |
| Richter Scale | Developed by Charles Richter (1935); logarithmic; each unit = 31.6x more energy |
| Moment Magnitude Scale (Mw) | More accurate for very large earthquakes; used alongside Richter |
| MMI Scale | Modified Mercalli Intensity – measures shaking at a location (I–XII) |
| Strongest earthquake ever | Valdivia, Chile – 9.5 Mw (1960) |
| 2004 Indian Ocean Tsunami | 9.1 Mw; off Sumatra; ~230,000 deaths; 14 countries; 26 Dec 2004 |
| Deadliest India earthquake (recent) | Bhuj, Gujarat – 7.7 Mw – 26 January 2001 – ~20,000 deaths |
| India’s worst reservoir quake | Koyna, Maharashtra – 1967 |
| India’s strongest earthquake | Assam – 8.6 Mw (1950) |
| Nepal Earthquake (Gorkha) | 2015 – 7.8 Mw – ~9,000 deaths |
| Turkey-Syria Earthquake | 2023 – 7.8 Mw – 60,000+ deaths |
| Ring of Fire earthquakes | ~90% of world’s earthquakes; ~75% of volcanoes |
| India Seismic Zone V | Northeast India, J&K, HP, Kutch, Andaman & Nicobar – highest risk |
| India Seismic Zone IV | Delhi-NCR, parts of Himalayas, Punjab, Haryana – high risk |
| Continental Drift Theory | Alfred Wegener – 1915 |
| Plate boundary most prone to strongest quakes | Convergent / Subduction zones |
| S-waves cannot pass through | Outer core – proves it is liquid (molten iron-nickel) |
| Tsunami wave speed (open ocean) | ~800–900 km/h |
| Tsunami word origin | Japanese – tsu (harbour) + nami (wave) |
| First seismoscope inventor | Zhang Heng, China – 132 CE |
| Serial number of this PPT | #92 in the Complete Foundation Batch |
Conclusion
Earthquake Geography is a topic that bridges physical geography with disaster science, current affairs, and environmental studies – making it one of the most versatile sources of marks in SSC and RRB exams. Understanding the distinction between focus and epicentre, mastering the behaviour of P and S waves, knowing India’s seismic zones, and connecting major earthquake events to their locations and impacts gives you a comprehensive toolkit for this topic.
The SSC Geography Earthquake PPT Slides (LEC #13), Serial #92, available at slideshareppt.net in bilingual Hindi + English format across 106 slides, provides a complete visual learning system for earthquake geography. Study the seismic wave table and India’s seismic zone map carefully, review the major earthquake events timeline, and use the Rapid Revision Cheat Sheet in the final week before your exam. This topic consistently delivers 2–4 marks per SSC or RRB paper for well-prepared students.